LLM Evaluation Metrics: What to Measure and How to Choose
Written By:
Matt Tanner
Published on
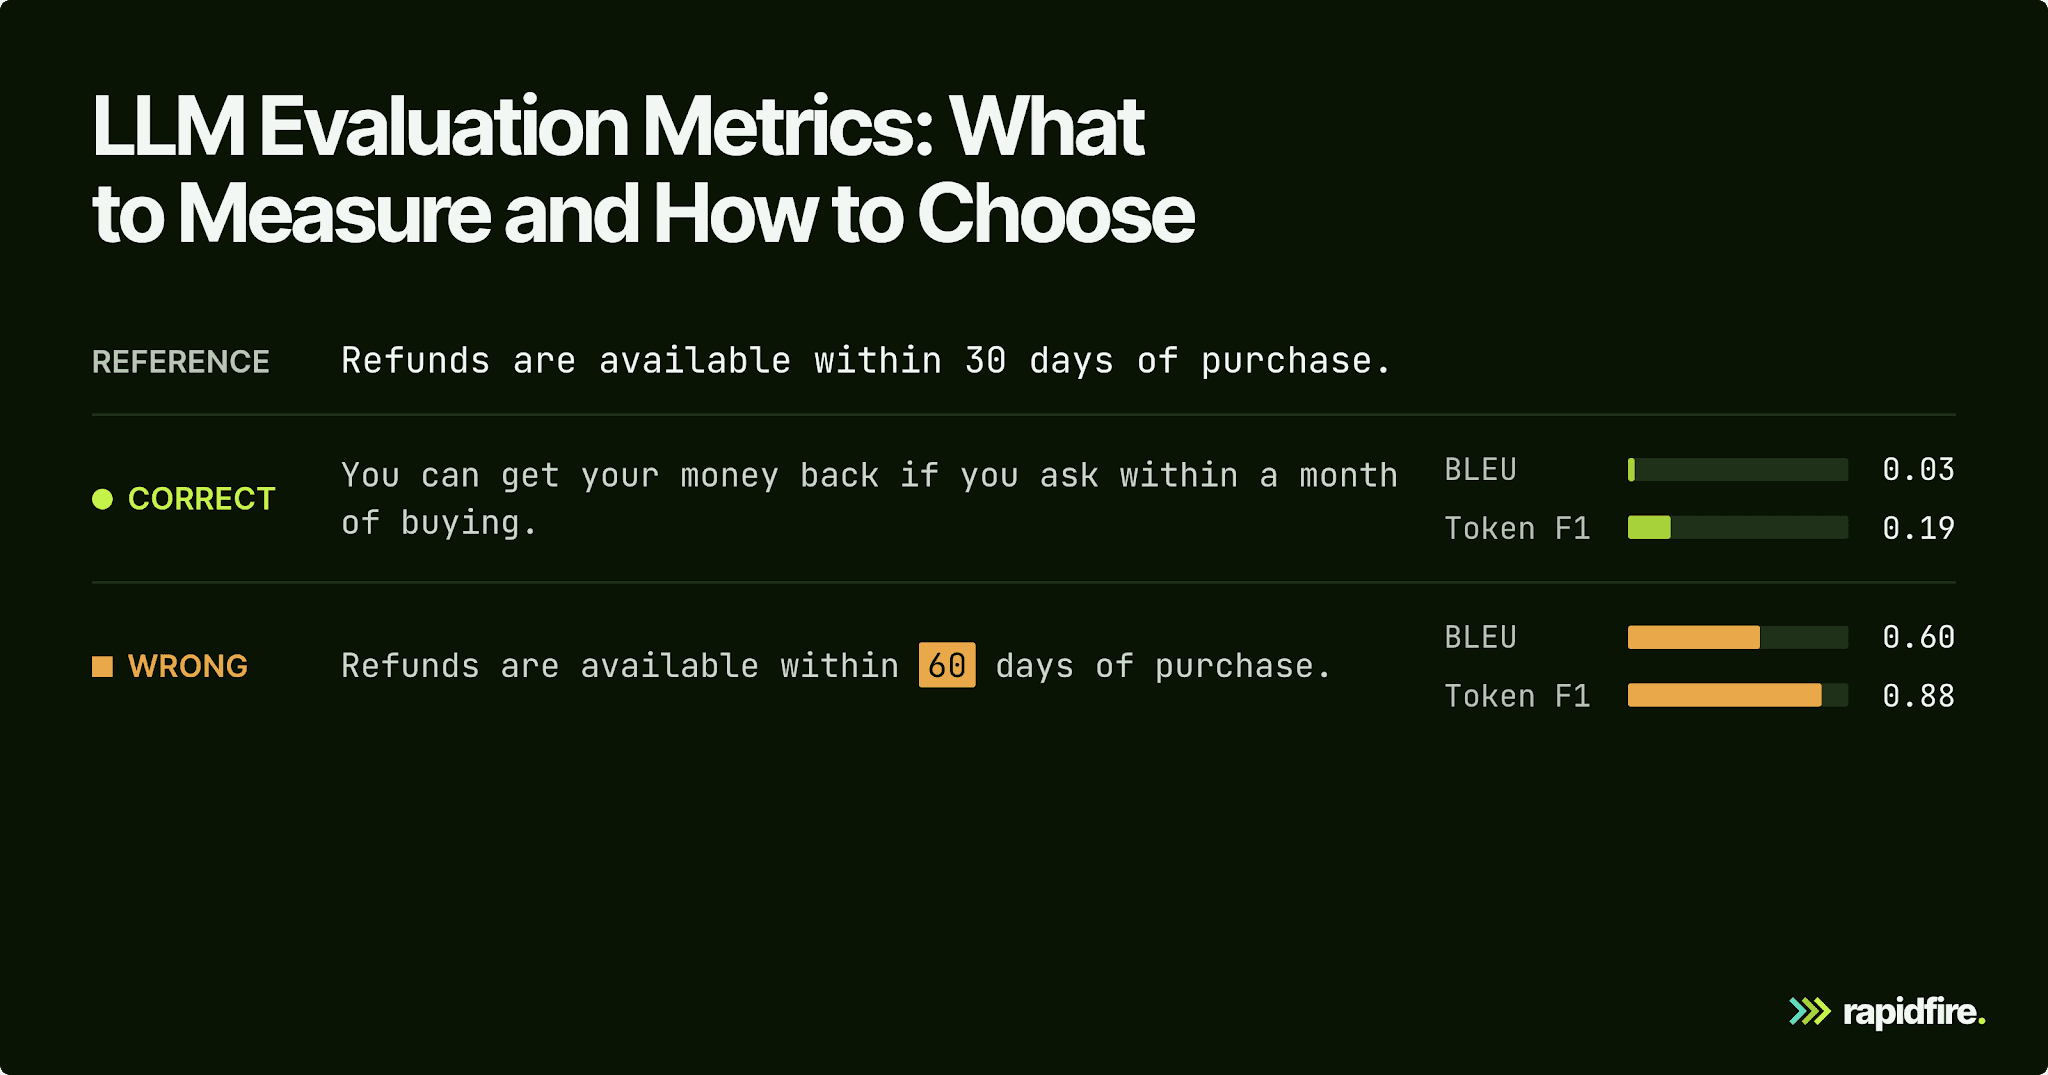
Your support bot tells a customer they have 60 days to request a refund. Your policy allows 30. The answer sounds helpful and uses almost the same words as the policy, but it is still wrong. If your evaluation rewards matching words, it can miss the mistake that matters most.
A different version of the bot might explain the correct policy in entirely different words. You need a way to tell that useful rewording apart from an incorrect answer. A high similarity score alone cannot do it.
The goal of LLM evaluation is to catch failures like that before changes reach users. Start with the question your app needs to get right, then choose a few metrics that test it. This guide explains the main options, shows where their scores can mislead you, and walks through comparing configurations on the same test cases.
What Are LLM Evaluation Metrics?
LLM evaluation metrics are scores that measure the quality, safety, and performance of a large language model's outputs. They come from three evaluation methods: code (exact match, n-gram overlap, format checks), another model (embedding similarity, LLM judges), or people. Each one turns "does this look right?" into a number you can compare across versions.
Metrics are one piece of LLM evals. The full eval is the procedure around them: an eval set of inputs (often with expected outputs), the system under test, one or more metrics, and a rule for reading the results.
LLM evaluation is harder than classic ML evaluation for three reasons:
Outputs are open-ended. A spam classifier has one right label per email, but a customer support answer about refunds can be phrased a thousand acceptable ways.
Many answers are partly right. An answer can get the refund window right and invent a restocking fee in the same sentence.
Outputs aren't stable. Run the same test more than once when two configurations score closely: one result may not represent how the app usually behaves. Even at a temperature of 0.0, Anthropic's API does not guarantee deterministic results.
Every metric below trades off those problems against cost.
Model Evaluation vs. System Evaluation
Public benchmarks help you shortlist a base model. MMLU tests knowledge across subjects, HellaSwag tests commonsense inference, and TruthfulQA tests whether a model repeats popular misconceptions. Stanford's HELM evaluates several dimensions together, including accuracy, robustness, and safety-related behavior. Each gives you evidence about a model under that benchmark's conditions.
Those benchmarks don't test your full application: a prompt template, maybe a retriever and a reranker, a model, and some post-processing code. A model can top a leaderboard and still quote the wrong refund window from your policy PDF because the retriever handed it the wrong chunk.
Your app still needs its own tests. In Mizrahi et al.'s experiment, paraphrasing instructions changed both scores and model rankings across 20 LLMs and 39 tasks. That is a reason to evaluate the prompts your application actually uses, rather than assume a leaderboard ranking will carry over.
| Model evaluation | System evaluation |
|---|---|---|
What's tested | A base or fine-tuned model | Your full pipeline (prompt, retrieval, model, post-processing) |
Data | Public benchmarks (MMLU, HellaSwag, TruthfulQA) | Your own eval set, built from real inputs |
Typical metrics | Benchmark accuracy | Task-specific correctness, faithfulness, format validity, latency, cost |
Answers the question | "Which model should we start from?" | "Is this version of our app better than the last one?" |
The rest of this guide is about system evaluation, the thing your team's LLM evaluation framework should be built around.
The Main Types of LLM Evaluation Metrics
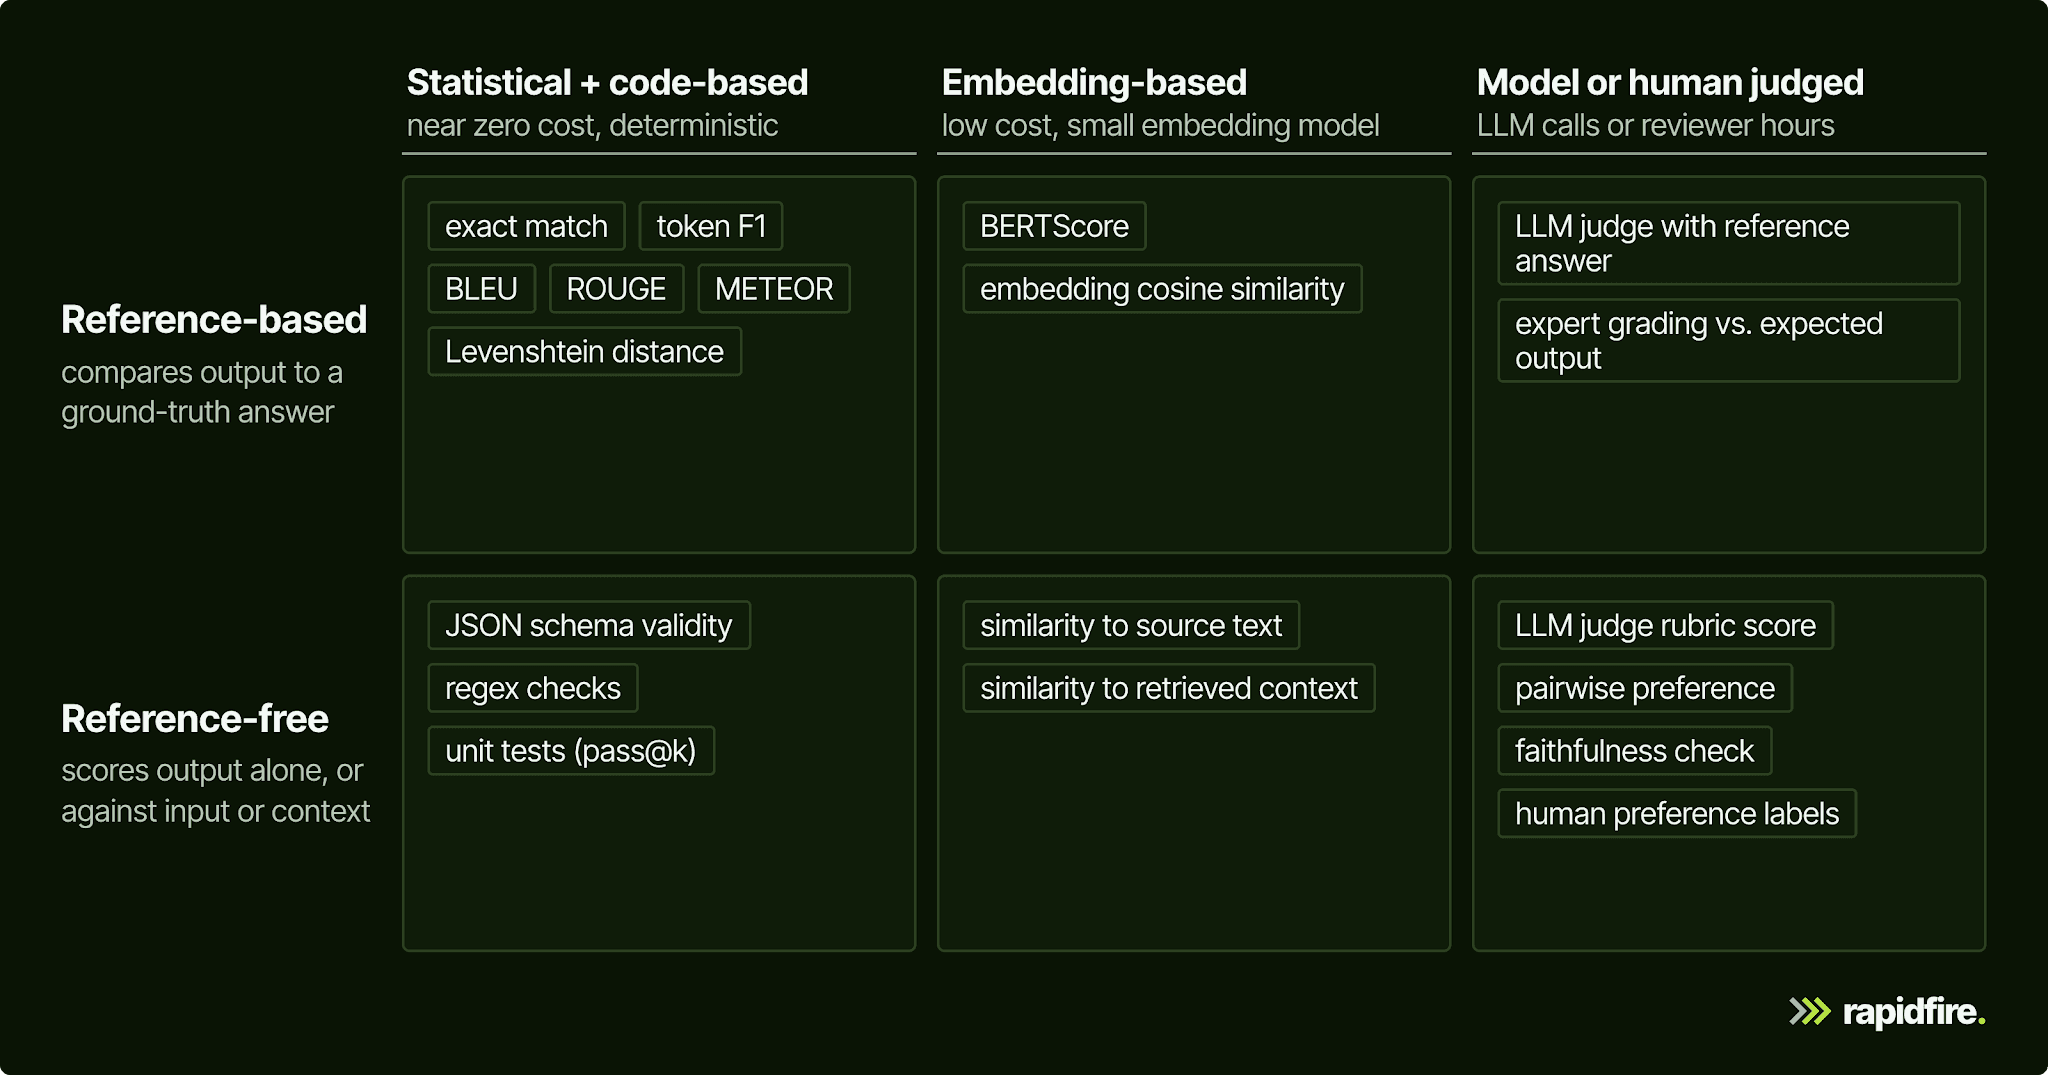
Use the table below to narrow the choices. If your task has a clear expected answer, you can compare against it directly. If several answers could be acceptable, you may need a rubric or a check against the source material. The five metric families differ in what they can judge and how much scoring costs.
Metric type | Examples | Needs a reference answer? | Cost and speed | Best for |
|---|---|---|---|---|
Reference-based statistical | Exact match, token F1, BLEU, ROUGE, METEOR, Levenshtein distance | Yes | Near zero, deterministic | Short answers, extraction, translation and summarization with good references |
Code-based checks | JSON schema validity, regex, unit tests, numeric tolerance | Usually no | Near zero, deterministic | Format rules, code generation, anything you can write as a test |
Semantic similarity | Embedding cosine similarity, BERTScore | Yes (or a source text) | Low; runs a small embedding model | Paraphrase-tolerant comparison to an expected output |
LLM-as-a-judge | Rubric scores, pairwise preference, faithfulness checks | Optional | Moderate; one or more LLM calls per output | Open-ended quality, tone, grounding, policy compliance |
Human evaluation | Expert grading, preference labels | Optional | High; hours to days | Defining "good" and validating every automated metric |
A reference answer is an example of the expected output, often called the ground truth. Reference-based metrics compare generated text against that answer. Reference-free metrics don't need an answer key: they can check the output itself or compare it with the input or retrieved context. For example, a JSON validity check needs no reference answer, while exact match does.
Reference-Based Statistical Metrics
These count overlapping words, n-grams, or characters between the generated text and the expected output. They're fast and repeatable, but they measure surface overlap rather than meaning. On open-ended generation tasks, BLEU and ROUGE can correlate poorly with human ratings.
Semantic Similarity Metrics
Semantic similarity metrics embed both texts and compare the vectors, so "a month" and "30 days" can land close together. That fixes paraphrasing but not facts, because "within 30 days" and "within 60 days" are also semantically close.
LLM-as-a-Judge Metrics
An LLM judge uses written criteria, or a rubric, to assess an answer. That lets you evaluate qualities such as tone or whether an answer follows a policy without requiring one exact wording. G-Eval's GPT-4 judge aligned more closely with human ratings than ROUGE-L and BERTScore on the SummEval summarization benchmark, but that result does not validate a judge for your app. Check it against human labels; our guide to LLM as a judge explains how.
Code-Based and Deterministic Checks
If you can write the rule as code, do. A regex for a required disclaimer, JSON schema validation, and unit tests for generated code don't need a model's opinion. The HumanEval benchmark, for example, scores generated functions by running them against unit tests, and its pass@k metric reports the chance that at least one of k samples passes. Many code-based checks are reference-free: "is this valid JSON?" needs no expected output at all.
Human Evaluation
Use human evaluation to define what good means for your product and label samples to validate automated metrics. When domain experts disagree, clarify the criteria before using their labels as a reference.
Common LLM Evaluation Metrics, Explained
Here's the opening example across the cheap reference-based metrics, with the reference "Refunds are available within 30 days of purchase."
Output | Correct? | Exact match | Token F1 | BLEU (sentence) | ROUGE-L F1 | Levenshtein distance |
|---|---|---|---|---|---|---|
"You can get your money back if you ask within a month of buying." | Yes | 0 | 0.19 | 0.03 | 0.18 | 45 |
"Refunds are available within 60 days of purchase." | No | 0 | 0.88 | 0.60 | 0.88 | 1 |
We computed these with sacrebleu 2.6.0 (sentence BLEU, default smoothing, divided by 100 to put it on a 0 to 1 scale), Google's rouge-score package, and SQuAD-style normalization for token F1. Exact match fails both, and every overlap and edit-distance metric prefers the wrong answer. That's by design: they measure surface similarity, and the wrong answer is one character away from the reference.
Accuracy and Exact Match
Accuracy is the share of test cases scored correct. For generated text, "correct" usually means exact match after normalization. The exact match metric from SQuAD, a question-answering dataset, ignores punctuation and articles and counts a prediction correct if it matches any of the ground-truth answers exactly. It works when answers are short and canonical: labels, numbers, entity names, and multiple-choice letters.
To get something matchable, our GSM8K math reasoning tutorial asks for the final answer after "####", extracts that number with a regex, and counts it correct only if it equals the reference. Exact match can reject valid answers when their wording differs from the reference.
Precision, Recall and F1
Precision asks how much of what you returned was correct. Recall asks how much of the correct answer you managed to return. F1 combines the two, using their harmonic mean so that a weak result on either one pulls the score down:
F1 = 2 × precision × recall / (precision + recall)
For generated text, token-level F1 counts the words shared by the prediction and reference, including repeated words. It gives partial credit when an answer contains some of the expected content. For retrieval, precision and recall apply the same idea to document IDs: did you retrieve relevant documents, and did you miss any?
Partial credit can hide an important error. The wrong refund window in the table scores 0.88 because seven of eight normalized tokens match. Use token F1 to spot overlap, then check critical facts such as the refund period separately.
BLEU, ROUGE and METEOR
BLEU and METEOR were designed for machine translation; ROUGE was designed for summarization. Their computations reflect those tasks.
BLEU (bilingual evaluation understudy) rewards matching sequences of words, called n-grams. It clips repeated matches and penalizes outputs that are too short. The score combines matches from one- to four-word sequences, so it is sensitive to phrasing even when two answers mean the same thing. Use it for comparisons within a consistent translation evaluation, not as a universal quality score. BLEU was designed to score a whole corpus, and the number of reference translations affects the result (Papineni et al., 2002).
ROUGE (recall-oriented understudy for gisting evaluation) flips the emphasis to recall. ROUGE-N is n-gram recall against reference summaries, and ROUGE-L is an F-measure based on the longest common subsequence. It suits summarization, where missing key content is the main failure.
METEOR matches single words by exact form, by stem, and by WordNet synonym, weights recall nine times as heavily as precision, and adds a penalty when matched words appear in a different order.
All three still score LLM outputs against the wording of a reference, so for free-form answers, treat them as cheap regression alarms rather than quality scores.
Levenshtein (Edit) Distance
Levenshtein distance is the smallest number of character insertions, deletions, and substitutions needed to turn one string into another. Normalize it by length to get a 0 to 1 similarity. It fits short structured strings where near-misses matter, like extracted IDs, product codes, or OCR fields. It fails wherever one character carries the meaning: our wrong refund answer is a distance of 1 from the reference.
Semantic Similarity and BERTScore
Use semantic similarity when a correct answer could be phrased in several ways. A sentence-embedding model turns each text into a vector, and cosine similarity measures how close those vectors are. BERTScore makes a finer-grained comparison: it matches contextual token embeddings between the answer and reference, then reports precision, recall, and F1.
These scores help you recognize paraphrases that word matching misses. They still measure similarity, so a high score needs to be interpreted alongside a correctness check.
For example, BERTScore's correlation with human ratings on SummEval's consistency dimension was 0.110, below ROUGE-2's 0.187. A metric that recognizes similar meaning is not automatically good at finding factual errors. For the refund bot, you would still need to check whether the answer gives the right refund window.
Perplexity
Perplexity asks how predictable a piece of text is to a model. Lower perplexity means the model assigns higher probability to the observed sequence. That can help you track a fine-tuning run or assess how well a model fits text from your domain; it does not tell you whether a generated answer is correct.
The calculation uses token log-probabilities: it exponentiates their average negative log-likelihood, also called cross-entropy. It applies to causal, or autoregressive, language models. Tokenization directly affects the score, so do not compare perplexities from models with different tokenizers as if they used the same scale.
Hallucination, Faithfulness and Relevance
Word overlap alone cannot reliably detect false claims presented confidently, which NIST AI 600-1 calls confabulation. Faithfulness metrics break an answer into claims and check each one against a source; in Ragas, the score is supported claims divided by total claims. Relevance metrics ask whether the answer addresses the question at all. Both are usually LLM-based metrics, and both get fuller treatment in the RAG section below.
Safety Metrics: Toxicity and Bias
Toxicity metrics can use classifiers to flag harmful output. The RealToxicityPrompts study used Perspective API to score comments likely to drive people away from a discussion through rudeness, disrespect, or unreasonable language. Bias metrics compare behavior across groups. The BBQ benchmark asks questions about people across nine social dimensions, once with an ambiguous context and once with enough context to answer. Models still leaned on stereotypes even when the context gave the right answer.
For your own app, a safety score is a classifier score with a threshold you choose, so validate both, and pair them with a red-team set of prompts you expect to be refused.
Operational Metrics: Latency, Cost, and Token Usage
Measure end-to-end latency per request and report percentiles, because users notice the slow tail. Read token counts from the API's usage field rather than tokenizing visible text yourself. Anthropic bills using those counts, which can differ from the tokens in the visible request and response. Then cost per test case is each token count times its own rate, plus any judge calls your metrics make. In Anthropic's API, prompt caching reports and prices cache writes and cache reads separately from input_tokens, so include those counts too.
LLM Evaluation Metrics Cheat Sheet
Here's a quick lookup for the metrics above.
Metric | What it measures | Good fit | Blind spot |
|---|---|---|---|
Exact match | Normalized output equals the reference | Labels, numbers, short canonical answers | Other valid rewordings may score 0 |
Token F1 | Token overlap with the reference | Short factual answers, extraction | High partial credit for a wrong number |
BLEU | Clipped n-gram precision with a brevity penalty | Translation, scored over a whole corpus | Wording, not meaning; depends on reference count |
ROUGE-N / ROUGE-L | N-gram recall; longest common subsequence F-measure | Summarization with good references | Wording, not meaning |
METEOR | Exact, stem and synonym matches, weighted toward recall | Translation | Still tied to the reference's wording |
Levenshtein distance | Character edits needed to match the reference | IDs, product codes, OCR fields | One-character errors that flip meaning |
Embedding similarity / BERTScore | Sentence-level or token-level embedding similarity | Paraphrase-tolerant comparison | Doesn't check facts |
Perplexity | How surprised a causal model is by a sequence | Fine-tuning runs, domain fit | Not correctness; tokenizer-dependent |
Faithfulness | Share of answer claims supported by context | RAG and other grounded answers | Claim extraction and checking need validation |
Answer relevance | Whether the answer addresses the question | RAG, support bots | A relevant answer can still be wrong |
LLM judge (rubric) | Score against your own criteria | Open-ended quality, tone, policy | Biased and prompt-sensitive; validate against humans |
Toxicity and bias | Classifier score, or behavior across groups | Safety gates | Only as good as the evaluator and threshold |
Latency, tokens, cost | Speed and spend per request | Every eval | Not a quality signal |
Metrics for RAG Systems and AI Agents
RAG (retrieval-augmented generation) systems add a retrieval step, so they need metrics on both halves. The headline generation metrics are faithfulness (are the answer's claims supported by the retrieved context?) and answer relevancy. The headline retrieval metrics are context precision (are relevant chunks ranked near the top?) and context recall (did retrieval find the information the answer needs?). Formulas, worked examples, and how to read them together live in our guide to RAG evaluation metrics.
Agents add tool calls and multiple turns. Measure task completion (did the end state match the goal?), tool correctness (right tool, right arguments), trajectory quality, and consistency over repeated attempts. The τ-bench paper introduced pass^k, which counts a task as solved only if the agent succeeds on all k independent trials, and success rates drop quickly as k grows. See our guide to AI agent evaluation for the full set.
How to Choose the Right LLM Evaluation Metrics
Choose metrics for the ways your app can fail:
Start from the failure you fear most, not from a metric list.
Pick three to five task-specific metrics, not twenty.
Pair at least one cheap deterministic check with one quality metric.
If you need a single score, set the weights before you see results.
Expect metrics to disagree, and keep every per-metric score.
Start From the Task, Not the Metric List
Write down how your outputs fail, then pick a metric that catches each failure:
Task | Failure you fear | Metric that catches it |
|---|---|---|
Support bot over policy docs | Invented refund windows or fees | Faithfulness to retrieved context; exact match on extracted numbers |
Extraction to JSON | Unparseable output, missing fields | Schema validity rate; field-level precision, recall, F1 |
Summarization | Dropping key points | ROUGE recall against good references, or a coverage rubric |
Code generation | Code that runs but is wrong | Unit test pass rate |
Classification or routing | Confusing two similar intents | Per-class precision, recall, F1 |
Our schema-linking case study illustrates this approach. The task was to identify which database tables and columns a SQL question needed. We therefore scored the table choices and column choices, giving each equal weight. Within each half, we averaged precision, recall, and F1. We tracked JSON validity separately so that correct selections and usable output were not collapsed into one number.
A simple baseline helped make those scores meaningful. An untuned 1.5B model scored 0.351, below a script that returned every table and column (0.367). Random guessing scored 0.021. The untuned model was not yet beating the simple strategy on this task.
Fine-tuning raised its score to 0.705 and JSON validity from 40.6% to 100%. The lesson is to compare a model with a basic alternative before deciding that its score represents useful progress.
The same goes one level up: whether to fix a weak app with RAG or fine-tuning is a question your metrics should settle.
Combine Cheap Checks With Quality Metrics
Check whether an output is usable before paying to assess its quality. For structured output, validate the JSON and required fields first. Then send passing answers to an LLM judge for criteria such as tone or faithfulness.
Keep the results separate: one metric tells you how often the format fails, and another tells you how good the usable answers are. Otherwise, an improvement in formatting can hide a decline in answer quality, or vice versa.
Composite Scores and Weighting
A composite score combines several metrics into one ranking. Its weights express what you value most, so choose them before looking at the results. Our case study with a global automotive manufacturer shows why that choice matters.
We evaluated 432 configurations of a RAG assistant on 28 expert-curated questions, using 7 Ragas metrics and 3 LLM-judge metrics. Answer correctness received 50% of the composite weight. The selected configuration ranked first on answer correctness but only about 282nd on faithfulness. It won under our chosen priorities; it did not lead on every measure.
The knobs disagreed too. In a one-knob-at-a-time check around the winner, swapping the embedding model barely moved faithfulness (about 0.02) but moved answer correctness by more than 0.2. A team tuning only on faithfulness would have called the embedder irrelevant.
That winner was the right choice for the objective we set, not a universal optimum. Re-weight toward faithfulness, and a different config wins. Because every config was scored on every metric, we could re-weight and re-pick without re-running anything, which is the practical case for storing per-metric scores alongside the composite.
How to Run LLM Evals: Offline, Online and Across Many Configurations
Start with a small labeled eval set: real inputs, expected outputs where an answer is checkable, and the edge cases you're worried about. Tune on a development split and confirm the final pick on held-out test cases you never looked at while tuning. In our schema-linking study, we picked the winner on validation and never on the held-out test.
Offline evals run that set before you ship. Every candidate gets the same inputs and metric code, so differences come from the candidate, not the ruler. Version your scorers like code. In our two-application case study, we reported one application's LLM-judge gain only qualitatively because the baseline and the sweep used different judge implementations. And since outputs aren't deterministic, re-run close calls more than once.
Online evals score a sample of production traffic after you ship, usually without reference answers. That's a separate stage with its own monitoring tools, and it catches drift and inputs your eval set missed.
Compare full configurations on the same eval set. Include chunking, retriever, and reranker settings alongside models and prompts. Our guide to prompt optimization covers the prompt side.
We built RapidFire AI to run these comparisons across configurations. You define your own metric function, and every configuration is scored on the same eval set with the same scoring logic. RapidFire is the experiment runner around your metrics, rather than a built-in metrics catalog.
Your metric function can use a library such as Ragas or DeepEval, or ordinary Python. The example below scores exact match and token F1 without calling a model. It separates two jobs: compute_metrics_fn collects counts for each batch, and accumulate_metrics_fn combines them into dataset-wide scores. In RapidFire, the first function is required; the second is optional unless you need custom aggregation such as the averages used here.
It runs with Python 3.9+ and the standard library.
Supply equal-length lists of answer strings and one reference string per prediction; a RapidFire postprocessor must populate
model_answerfromgenerated_text.The normalization and F1 follow SQuAD v1.1: empty normalized answers score 0 F1, even if exact match is 1. Add an explicit no-answer policy for datasets with unanswerable questions.
The two test answers at the end make the result easy to inspect: one matches its reference after normalization, and the other does not. Running the example prints 0.5 for both metrics. It adds counts across batches before dividing, so a small batch does not receive the same weight as a large one:
The example also labels the final rates as algebraic and gives their value range. This metadata lets RapidFire show estimated metrics with confidence intervals before the entire eval set has finished. You can use those early results to stop weak configurations, then clone promising ones and try nearby variations.
For those estimates, the dataset is processed in smaller groups called shards. Shuffle a sorted eval set first because shards follow dataset order. API-only experiments do not need a GPU. Once you select a configuration, check it on held-out cases: winning on this eval set does not establish that it is better in production.
Common Mistakes With LLM Evaluation Metrics
Over-optimizing a single metric. The 432-config winner, picked on a composite weighted toward answer correctness, ranked about 282nd on faithfulness. Track at least one metric for each failure you care about.
Deciding from a few spot checks. Inspect outputs to diagnose failures, but compare configurations across the fixed eval set and report uncertainty when scores are close.
Reporting small eval sets without intervals. An 80% pass rate on 50 test cases has a 95% Wilson interval of about 67% to 89%. Report the interval, or at least the sample size, next to the score.
Changing the scorer mid-comparison. A new judge prompt, judge model, or normalization rule changes every number, so re-score baselines when it changes.
Ignoring judge bias. Zheng et al. found position and verbosity effects in LLM judging; whether judges favor their own outputs remained inconclusive. Validate a judge against human labels before trusting it.
Leaking test data into tuning. If your few-shot examples or prompt tweaks were chosen by looking at the test set, your test score is really a tuning score.
Comparing incomparable numbers. BLEU depends on the number of references, and perplexity depends on the tokenizer, so scores from different setups don't line up.
Conclusion
Every metric is blind somewhere: overlap metrics to meaning, similarity metrics to facts, and judges to their own biases. Pick a few that match how your app fails, decide how to weigh them before you see results, and keep every per-metric score. Compare configurations on the same eval set so you can see which trade-offs each change introduces.
To try that on a real pipeline, open our RAG notebook on Colab. It runs four retrieval configs (two chunk sizes, two reranker settings) on one eval set with no local setup. Its metrics function, which scores precision, recall, F1, NDCG@5, and MRR, is where your own metrics go. Prefer your own machine? pip install rapidfireai and start from the GSM8K tutorial, which shows the exact-match version end to end. If you'd rather talk through your eval setup first, book a technical call with our team.
FAQ
What Metrics Should I Use to Evaluate an LLM?
Start from the task. Use exact match or token F1 for short factual answers, schema validity plus field-level F1 for structured output, and a validated LLM judge with a clear rubric for open-ended answers. For RAG, add faithfulness and context recall. Track latency and cost alongside quality every time.
What Is the Difference Between Reference-Based and Reference-Free Metrics?
Reference-based metrics compare an output to an expected output, like exact match, BLEU, ROUGE, or BERTScore. Reference-free metrics score the output on its own or against the input or retrieved context, like JSON validity, toxicity, faithfulness, or a rubric-based LLM judge. Reference-free metrics need no labeled answers, but most need a model to score.
Are BLEU and ROUGE Still Useful for LLMs?
Yes, in a narrow role. They're cheap, deterministic, and still sensible for translation and summarization when you have good references. For free-form answers, they correlate poorly with human judgment and can rank a wrong answer above a right one. Use them as fast regression alarms next to a meaning-aware metric.
How Many Test Cases Do I Need for LLM Evals?
Enough that the uncertainty is smaller than the gap you care about. For an observed 80% pass rate, the 95% Wilson interval is roughly 71% to 87% at 100 test cases, 76% to 84% at 400, and 77% to 82% at 1,000. Start with 100 or so to find failures, and grow the set before you compare close configs.